
What a Record Keeneland September Is Made Of
Every book got more expensive, nearly all of the five-year growth in horses sold came from the final two sessions, and essentially the same buyer base spent a lot more money.
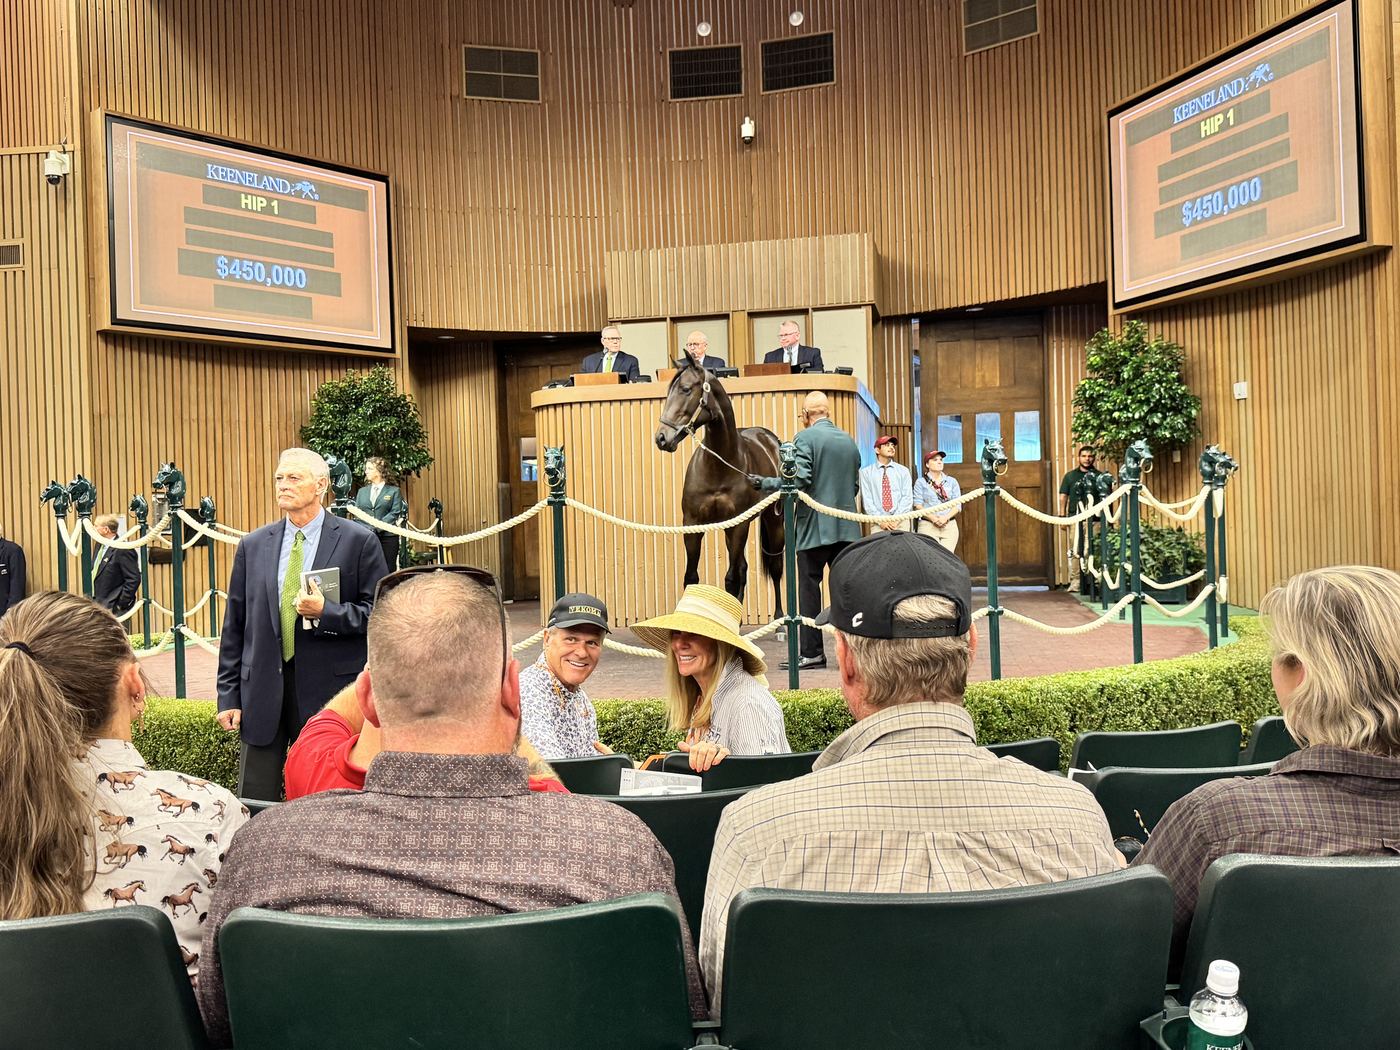
In the years I have followed Keeneland September, the headlines and press releases tend to have a familiar rhythm: gross up, average up, median up, another record.
This year earned every one of them. Keeneland sold 2,856 yearlings through the ring for $536.7 million, an average of $187,933 and a median of $85,000. Add the reported post-sale transactions and total gross reached $558.3 million. It was an extraordinary sale.
But a sale this large always has more going on underneath the headline numbers. There were 4,642 horses in the catalog, 12 sessions, six books and buyers operating everywhere from the four-figure market to seven figures. Somewhere inside all of that are usually a few stories that help explain where the market is actually moving.
So after spending most of September looking at sires, books, first-crop yearlings and pinhooks, I went back through eight years of the whole sale.
A few things popped out. Keeneland sold fewer horses through the ring than last year and still generated another $26.2 million. The median rose in every book. Nearly all of the growth in horses sold since 2021 came from the final two sessions. One horse in five entered in the catalog never reached the ring. Seventy million-dollar yearlings generated almost one dollar in five of total gross.
And after all that growth in prices, the number of reported buyers is almost exactly where it was several years ago.
The Record Is Legit
Last September, Keeneland sold 2,903 yearlings through the ring for $510.5 million. This year, 2,856 sold for $536.7 million.
Forty-seven fewer horses produced another $26.2 million.
The longer view makes the price move even clearer. In 2019, the median September yearling brought $47,000. This year it was $85,000, an increase of 81 percent. Over the same period, the number of reported sales increased by about 2 percent.
Figure 1 · Price, not volume
Gross rose by half. The number of horses sold did not move.
Show the data
| Sale | Gross | Yearlings sold |
|---|---|---|
| 2019 | $372.3M | 2,974 |
| 2020 | $249.0M | 2,481 |
| 2021 | $364.5M | 2,789 |
| 2022 | $418.4M | 2,965 |
| 2023 | $408.1M | 2,884 |
| 2024 | $428.1M | 2,894 |
| 2025 | $531.7M | 3,078 |
| 2026 | $558.3M | 3,033 |
| Sale | Cataloged | Withdrawn | Clearance | Average | Median |
|---|---|---|---|---|---|
| 2019 | 4,644 | 19.0% | 79.1% | $125,201 | $47,000 |
| 2020 | 4,272 | 22.3% | 74.8% | $100,354 | $37,000 |
| 2021 | 4,037 | 18.3% | 84.5% | $130,698 | $65,000 |
| 2022 | 4,153 | 16.2% | 85.2% | $141,097 | $70,000 |
| 2023 | 4,198 | 17.8% | 83.5% | $141,489 | $67,000 |
| 2024 | 4,407 | 19.7% | 81.8% | $147,926 | $70,000 |
| 2025 | 4,692 | 20.3% | 82.4% | $172,755 | $80,000 |
| 2026 | 4,642 | 20.7% | 82.4% | $184,066 | $85,000 |
Reported sales include identifiable post-sale transactions. Clearance is reported sales as a share of horses offered. Withdrawals are measured against the original catalog.
The last two years are a useful comparison because the proportion of offered horses finding buyers barely changed. Clearance finished at 82.4 percent in both years, and Keeneland's reported buy-back rate was essentially identical, 22.32 percent in 2025 and 22.43 percent this year.
The additional money therefore came with roughly the same level of transaction friction. Buyers simply paid more for the horses they bought.
Every Book Got More Expensive
One question I always have when a sale average jumps is how much of the move came from the mix of horses being sold. Add more expensive horses, subtract cheaper ones, and the average can rise even if comparable horses have changed very little.
September gives us a decent check on that because we can follow the median through each book. This year, all six books moved higher. The same thing happened last year.
The size of the move was actually larger later in the sale. Books 1 through 3 increased between 3 and 5 percent at the median. Books 4 through 6 increased between 14 and 15 percent.
Book 1 went from $525,000 to $550,000. Book 4 moved from $70,000 to $80,000. Book 5 went from $35,000 to $40,000, and the final two sessions went from $13,000 to $15,000.
Figure 2 · The whole curve lifted
Every book is more expensive than it was five years ago.
Show the data
| Book | 2021 | 2022 | 2023 | 2024 | 2025 | 2026 | Change |
|---|---|---|---|---|---|---|---|
| Book 1 | $325K | $450K | $400K | $450K | $525K | $550K | +69% |
| Book 2 | $200K | $215K | $215K | $250K | $275K | $288K | +44% |
| Book 3 | $100K | $120K | $110K | $125K | $155K | $160K | +60% |
| Book 4 | $52K | $57K | $55K | $57K | $70K | $80K | +54% |
| Book 5 | $27K | $27K | $27K | $30K | $35K | $40K | +48% |
| Book 6 | $12K | $10K | $10K | $11K | $13K | $15K | +25% |
Over five years, the whole curve has lifted. Book 1's median is up 69 percent since 2021, Book 3 is up 60 percent, Book 4 is up 54 percent and Book 5 is up 48 percent. Even Book 6, which has moved more slowly than the rest, is up 25 percent.
For breeders, I think this is one of the better stories in the sale. The strength reached a long way down the catalog. September became more expensive at the top, in the middle and at the back.
The volume story went in a very different direction.
September Has Grown at the Back
Keeneland sold 2,789 yearlings in 2021 and 3,033 this year, an increase of 244 horses in the reported results.
Book 6 alone added 286.
The final two sessions sold 244 yearlings in 2021 and 530 this year. Books 1 through 5, taken together, actually sold 42 fewer horses.
| Part of September | Sold in 2021 | Sold in 2026 | Change |
|---|---|---|---|
| Books 1 through 5 | 2,545 | 2,503 | -42 |
| Book 6, sessions 11 and 12 | 244 | 530 | +286 |
Reported sales include post-sale transactions.
When people talk about September becoming a larger sale, this is really what has happened. Keeneland has created much more room at the back of the catalog.
In 2021, 453 horses were cataloged in the final two sessions. Last year there were 1,014. This year there were 977. In five years, Keeneland has added roughly 500 spots to the least expensive part of the sale, where the median selling price this September was $15,000.
I find that fascinating because it changes what Keeneland September is. The sale still contains one of the most elite yearling markets in the world, but it has also become an outlet for hundreds of horses that once would have needed to find another venue, sell privately or stay home.
And Keeneland has managed that expansion while the population of foals feeding the North American yearling market has been shrinking.
Keeneland Is Taking a Bigger Share of a Smaller Foal Crop
The North American foal crop behind the 2019 yearling market numbered 21,298. The estimate for the 2025 crop, which supplied this year's yearlings, is 17,300.
That is a decline of about 19 percent.
Over the same stretch, Keeneland September went from 4,644 cataloged yearlings to 4,642. The catalog is almost exactly the same size today as it was in 2019.
Measured against those corresponding foal crops, the September catalog was equivalent to 21.8 percent of the North American crop in 2019 and 26.8 percent this year. I use "equivalent" deliberately here because an exact share would require matching every cataloged horse to its place of foaling, but the scale is still revealing.
Keeneland has maintained a 4,600-horse September sale while the underlying North American foal population has dropped by almost one fifth.
Some of the pressure shows up elsewhere. Fasig-Tipton's Midlantic Fall Yearlings sold 386 horses in 2022 and 161 in 2025. Kentucky October has held up much better, moving from 1,008 sold in 2019 to 1,103 in 2025. Horse-level tracking would be needed to say exactly how much inventory moved from one sale to another, but the regional yearling market has clearly carried more of the contraction.
September, meanwhile, has become a bigger piece of the industry around it.
One Horse in Five Never Reached the Ring
This is one of the statistics I think deserves more attention.
Keeneland cataloged 4,642 yearlings this year. Nine hundred sixty were withdrawn before reaching the ring, or 20.7 percent of the catalog. In 2022, the withdrawal rate was 16.2 percent, and it has risen in each year since.
The distinction matters when we talk about clearance. Keeneland reported 82.4 percent clearance among horses that were offered. Start instead with every horse entered in the original catalog, and 65.3 percent ultimately produced a reported sale. In 2022, 71.4 percent of the catalog did.
Those are different views of the same sale. Clearance tells us how buyers treated the horses that showed up. Catalog-to-sale conversion tells us what happened to the larger group owners originally intended to sell.
Most of the withdrawals come from Book 6, which makes sense. Three hundred sixty-four of the 977 horses cataloged there came out this year, a 37.3 percent withdrawal rate. Since 2021, Book 6 has consistently run between about 31 and 44 percent withdrawals.
With a $15,000 median, the economics can get pretty simple. Shipping, preparation, veterinary work and commission represent a meaningful percentage of the expected proceeds. Owners and consignors have several opportunities to decide whether taking the horse to the ring still makes sense.
The movement in Books 3 and 5 caught my eye more. Book 3's withdrawal rate has gone from 11.0 percent in 2022 to 15.4 percent this year. Book 5 moved from 11.0 percent to 16.2 percent.
More of the filtering is happening before the horse ever enters the published clearance calculation. For anyone trying to understand seller experience at September, I would watch withdrawals right alongside RNAs.
Seventy Horses Supplied Almost One Dollar in Five
The top of this sale has become something else.
Seventy yearlings sold for at least $1 million this September. They generated $105.5 million, or 18.9 percent of the entire sale gross.
Two years ago, 36 seven-figure yearlings accounted for 11.1 percent of gross. In 2021, there were 15 and they supplied 5.2 percent.
Figure 3 · The top pulled away
Seventy horses produced almost one dollar in five.
Show the data
| Sale | Seven-figure yearlings | Share of gross |
|---|---|---|
| 2019 | 22 | 11.0% |
| 2020 | 15 | 7.6% |
| 2021 | 15 | 5.2% |
| 2022 | 30 | 9.0% |
| 2023 | 30 | 10.2% |
| 2024 | 36 | 11.1% |
| 2025 | 56 | 14.5% |
| 2026 | 70 | 18.9% |
Forty-one of this year's million-dollar horses sold in Book 1. Twenty-four came from Book 2 and five from Book 3. Five sires supplied 54 of the 70: Gun Runner had 15, Not This Time 12, Into Mischief 11, and Flightline and Nyquist eight each.
I have written a lot this September about the narrowing sire market at the premium end, and this is another expression of it. An enormous amount of money is concentrating around a relatively small group of horses and stallions.
But the million-dollar horses can also distract from how much work the middle of the sale did.
The $200,000 to $499,999 band contained 627 sales this year and generated 33.4 percent of total gross, the largest share of any price band. Another 201 horses sold between $500,000 and $999,999 and supplied 24.1 percent.
So while 70 horses made the biggest headlines, the record rested on a much broader premium market underneath them.
The Cheap End Is Getting Smaller
At the other end of September, the population is moving in the opposite direction.
Keeneland sold 1,043 yearlings for less than $25,000 in 2019. This year it sold 618. Below $50,000, the number of transactions has fallen from 1,496 to 1,076, a decline of 28 percent.
| Sale price | Sold in 2019 | Sold in 2025 | Sold in 2026 | Share of 2026 gross |
|---|---|---|---|---|
| Under $25,000 | 1,043 | 736 | 618 | 1.3% |
| $25,000 to $49,999 | 453 | 412 | 458 | 2.8% |
| $50,000 to $99,999 | 458 | 539 | 516 | 6.2% |
| $100,000 to $199,999 | 415 | 529 | 543 | 13.3% |
| $200,000 to $499,999 | 465 | 591 | 627 | 33.4% |
| $500,000 to $999,999 | 118 | 215 | 201 | 24.1% |
| $1 million and up | 22 | 56 | 70 | 18.9% |
Reported sales grouped by price, including post-sale transactions.
Some of that movement is simply what inflation looks like inside an auction. Horses that once landed in the $25,000 to $50,000 range move into the next bracket, and horses that once brought $150,000 begin bringing $200,000.
For a buyer working with a fixed budget, though, the practical effect is real. Fifty thousand dollars buys access to a much smaller slice of Keeneland September than it did in 2019.
That is another way of saying this sale has become more expensive, and it leads to the number I found most surprising.
The Buyer Count Barely Moved
Keeneland's published results show 1,238 distinct buyer labels in 2019. There were 1,280 in 2022, 1,268 last year and 1,276 this year.
Across eight consecutive sales, the number of horses purchased per reported buyer has stayed between 2.26 and 2.43.
Buyer labels have some obvious limitations. An agent can appear under several principals, partnerships can change names, and related ownership can show up in different forms. I would treat this as a measure of reported purchasing identities rather than a perfect count of individual owners.
Even with that caveat, I expected the number to have moved more.
Since 2019, the September median has climbed from $47,000 to $85,000. Total gross is up roughly 50 percent. The number of seven-figure horses has gone from 22 to 70. Keeneland has held a catalog of roughly 4,600 horses while the North American foal crop has fallen sharply.
The buyer count is up by 38.
That is both impressive and worth thinking about. The existing buyer base has absorbed a tremendous amount of additional value. It has paid more at nearly every level of the sale, supported 70 million-dollar horses and helped produce the richest yearling auction on record.
The next stage of growth is a different question. At some point, higher prices carried by roughly the same number of people become a different kind of market than growth supported by a larger population of owners.
I started this exercise thinking I was going to write about a record sale. I came away thinking just as much about the shape of it.
Keeneland September is more expensive across every book. It is much larger at the back than it was five years ago. It commands a growing share of a shrinking foal crop. More horses disappear from the catalog before reaching the ring, while the seven-figure market has become an enormous business of its own.
And through all of it, roughly the same number of reported buyers keep writing bigger checks.
For me, that is the most interesting part of the record.
Methodology. Thoroughbred Intelligence reviewed Keeneland September results from 2019 through 2026, 35,045 cataloged hips. Unless specifically identified as through-ring figures, reported sales include identifiable post-sale transactions. Clearance is reported sales divided by reported sales plus remaining RNAs. Withdrawal rates use the original catalog as the denominator. Books are consecutive session pairs, with Book 1 covering sessions 1 and 2 and Book 6 covering sessions 11 and 12. Buyer counts use reported purchasing labels and do not consolidate agents, partnerships or related beneficial ownership. Foal-crop comparisons use the preceding year's North American crop, with 2025 treated as an estimate.
Two reconciliation notes. Keeneland's closing release reports 3,034 total reported sales for 2026 while the hip-level export sums to 3,033, a difference of one horse; this article uses the separately confirmed through-ring count of 2,856 in the opening and hip-level totals for the book and price-band analysis. One 2025 hip carries no recorded result in Keeneland's export and is excluded from every calculation here.