
What We Learned Through Book 3 at Keeneland September
Book 3 changed the shape of the sale. The middle strengthened, sire concentration fell and a few early stallion reads started to look very different.
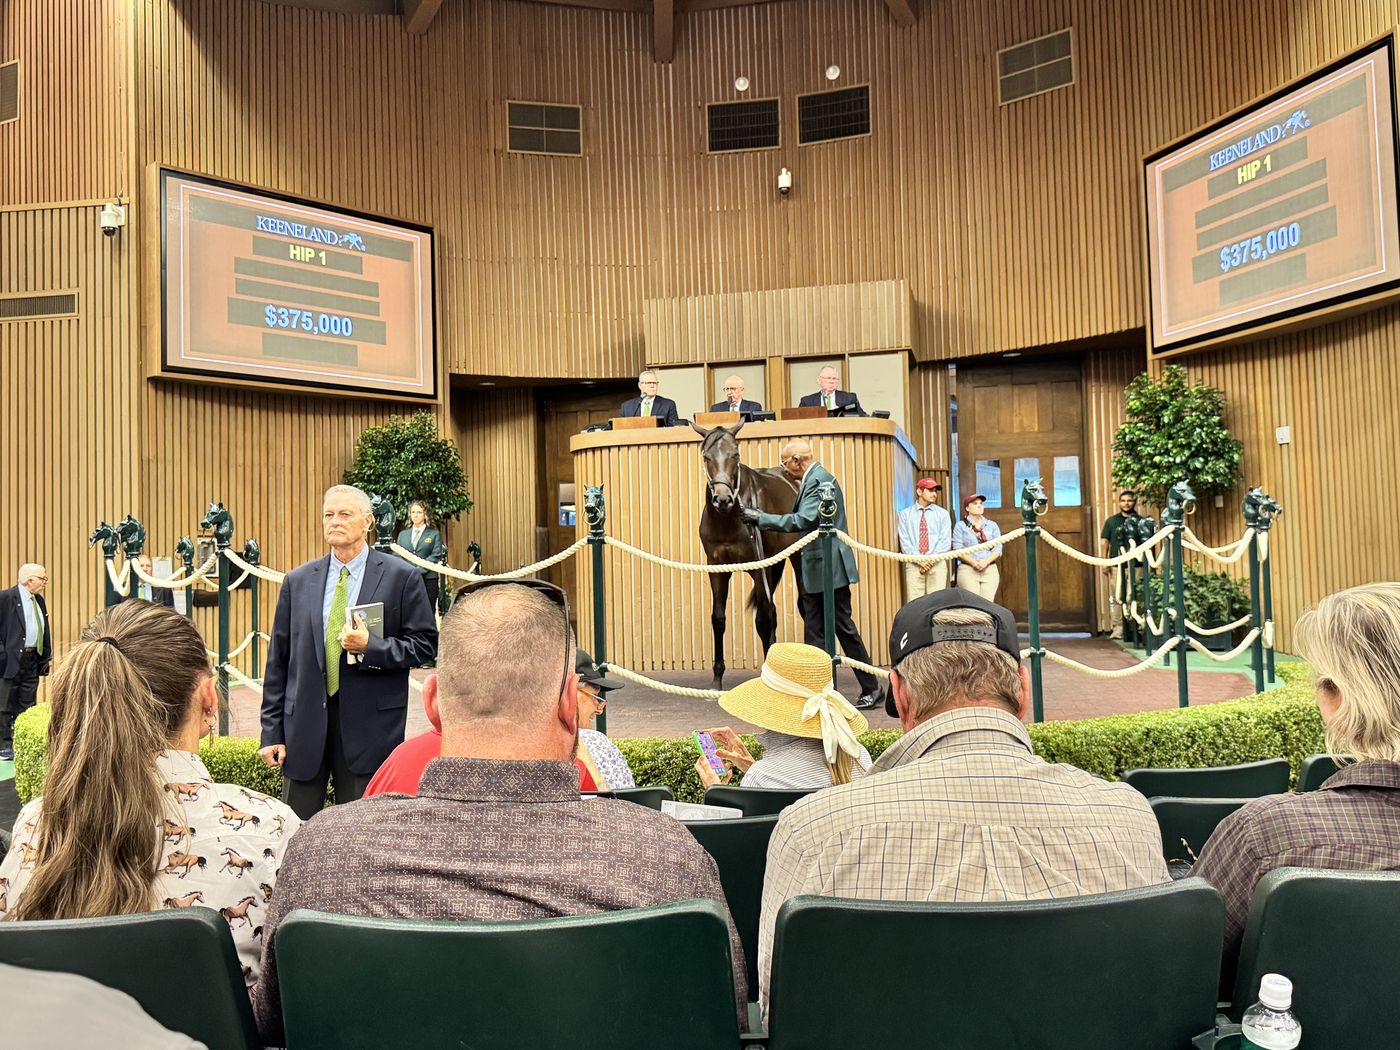
By the end of Book 2, our read on Keeneland September was fairly clear. Buyers were spending more money, seven-figure horses were becoming more common, clearance was slipping and much of the additional capital was concentrating around a relatively small group of stallions.
Book 3 kept the price growth going, but the shape of that growth changed considerably. The median rose faster than the average, the middle of the market strengthened and sire concentration fell sharply.
After six sessions, 1,150 yearlings have sold through the ring for roughly $430 million. Last year, 1,216 had sold at the same point for $417.6 million. Keeneland has therefore generated about $12.4 million more gross while selling 66 fewer horses.
Go back to 2023 and the change is much larger. Through six sessions that year, 1,199 horses brought $319.9 million. The average was $266,776 and the median $200,000. This year the average is $373,947 and the median $275,000.
| Through Book 3 | Sold | Gross | Average | Median | Buy-back rate |
|---|---|---|---|---|---|
| 2023 | 1,199 | $319.9M | $266,776 | $200K | 26.1% |
| 2024 | 1,166 | $336.4M | $288,515 | $210K | 28.5% |
| 2025 | 1,216 | $417.6M | $343,439 | $250K | 26.3% |
| 2026 | 1,150 | $430.0M | $373,947 | $275K | 28.8% |
The sale is producing substantially more money from roughly the same population it was moving three years ago. It is also doing so with the highest buy-back rate of the four.
That tension remains one of the defining features of the 2026 market. Buyers have plenty of money, and they remain willing to walk away when the horse or the price does not work.
Figure 1 · Six sessions
More money, fewer horses, and the highest buy-back of the four
Show the data
| Through Book 3 | Sold | Gross | Average | Median | Buy-back rate |
|---|---|---|---|---|---|
| 2023 | 1,199 | $319.9M | $266,776 | $200K | 26.1% |
| 2024 | 1,166 | $336.4M | $288,515 | $210K | 28.5% |
| 2025 | 1,216 | $417.6M | $343,439 | $250K | 26.3% |
| 2026 | 1,150 | $430.0M | $373,947 | $275K | 28.8% |
Book 3 Has Moved a Long Way
Book 3 itself has changed considerably in three years.
| Book 3 | Sold | Gross | Average | Median | Through-ring sale rate |
|---|---|---|---|---|---|
| 2023 | 562 | $85.6M | $152,251 | $115K | 77.1% |
| 2024 | 526 | $83.9M | $159,468 | $130K | 72.9% |
| 2025 | 545 | $110.0M | $201,804 | $160K | 74.7% |
| 2026 | 517 | $111.9M | $216,487 | $175K | 72.8% |
Since 2023, the Book 3 average has risen roughly 42 percent and the median more than 50 percent, even as the number sold has fallen by 45 horses.
This year alone, the average rose another 7.3 percent from 2025 while the median rose 9.4 percent despite 28 fewer horses selling.
That relationship between average and median is one of the more important differences between Book 3 and the first four sessions.
The Middle Moved Too
Books 1 and 2 gave us a market where average was running away from median. A lot of the incremental money was accumulating toward the upper end.
Book 3 was much broader.
When we divide the through-ring results by price rank, the distribution looks remarkably similar to last year, except almost every part of it costs more.
| Book 3 segment | 2025 average | 2026 average | 2025 share of gross | 2026 share of gross |
|---|---|---|---|---|
| Bottom 25% | $56K | $61K | 6.9% | 7.0% |
| Middle 50% | $167K | $177K | 41.3% | 40.8% |
| Top 10% | $568K | $626K | 28.4% | 29.1% |
The 25th percentile stayed at $100,000. The median moved from $160,000 to $175,000, while the 75th percentile increased from $250,000 to $275,000.
The middle 50 percent averaged almost $177,000 this year and maintained essentially the same share of Book 3 gross. A handful of expensive horses helped the totals, but they did not create the result.
For breeders with the kind of horse that realistically belongs in Book 3, this may be one of the better findings in the sale. The improvement is reaching well beyond the session toppers.
Figure 2 · Book 3 itself
Book 3 is selling fewer horses for more money
Show the data
| Book 3 | Sold | Gross | Average | Median | Through-ring sale rate |
|---|---|---|---|---|---|
| 2023 | 562 | $85.6M | $152,251 | $115K | 77.1% |
| 2024 | 526 | $83.9M | $159,468 | $130K | 72.9% |
| 2025 | 545 | $110.0M | $201,804 | $160K | 74.7% |
| 2026 | 517 | $111.9M | $216,487 | $175K | 72.8% |
The Sire Market Opens Up
One of the clearest trends through Books 1 and 2 was the increasing concentration of money around a small group of stallions.
The Top 10 sires accounted for almost 70 percent of reported gross through the first four sessions.
In Book 3, that figure falls to about 37 percent. It has actually been moving lower, from roughly 44 percent in 2024 to 39 percent last year and 37 percent this year. The Top 5 account for only about 22.5 percent of Book 3 gross.
The falling sire concentration suggests the individual carries more of the valuation as the sale moves along. Buyers are still willing to spend substantial money, but they are doing it across a much broader stallion population.
That is an important counterweight to what we saw at the front of the sale, where sire fashion has become increasingly powerful.
The Bigger Buyers Stayed in the Game
The buyer concentration numbers moved in the opposite direction.
The Top 10 reported buyer labels accounted for about 23.5 percent of current Book 3 spending this year, up from roughly 18 percent last year and 19 percent in 2024.
Many of the same groups active in Books 1 and 2 stayed involved deeper into the sale. The FRC/Starlight/Madaket partnership bought eight Book 3 yearlings for about $4.5 million. Klaravich bought 11 for $3.5 million. RTM bought eight for $3.45 million. Lauren Carlisle signed for seven totaling about $3.4 million. Wesley Ward's buying team, Pin Oak, CHC/Maverick/Light Post and other familiar names also remained active.
Put the buyer and sire numbers together and a useful picture emerges. Many of the larger buying groups stayed deep into September, but their money spread across a much wider range of stallions.
For breeders, that may be one of the healthiest signals in Book 3. A horse does not have to be by one of the five hottest sires on the grounds to attract serious money from serious people.
The $500,000 Line Has Not Moved
Through six sessions, exactly 263 yearlings have sold through the ring for at least $500,000, the same number as last year.
The difference is what happened above that level. Horses selling for $750,000 or more increased from 111 to 133, while the number of million-dollar yearlings rose from 55 to 70.
The premium population has not expanded at the $500,000 threshold. More of those horses are being pushed into higher price brackets.
That is useful context for all the seven-figure headlines. The ceiling is stretching faster than the entrance to the premium group.
Life Is Good Looks Much More Interesting Now
Life Is Good was already one of the more encouraging second-crop stories after Books 1 and 2. Book 3 strengthened the case considerably.
| 2025 | 2026 | |
|---|---|---|
| Offered | 22 | 19 |
| Reported sold | 20 | 18 |
| Sale rate | 90.9% | 94.7% |
| Average | $188,250 | $363,889 |
| Median | $167,500 | $297,500 |
| Gross | $3.77M | $6.55M |
His average nearly doubled, but the median is what makes the result convincing. It rose almost 78 percent to $297,500, while 18 of 19 offered horses are currently reported sold.
The $1.25 million colt obviously helped the average. A median approaching $300,000 tells us the strength ran much deeper through the draft.
For a young stallion whose first runners are only beginning to answer the racing question, the second-crop commercial response is getting difficult to ignore.
Maxfield's Rebound Now Has Some Depth
Our first look at Maxfield came with an obvious caveat. Only five had sold in Books 1 and 2, so a sharp increase in average and median was interesting without giving us much confidence about depth.
Book 3 gave us a better sample.
Fifteen Maxfields were offered and 13 are currently reported sold, an 86.7 percent sale rate. They averaged $287,308 with a $250,000 median.
Last year's Book 3 group produced eight reported sales from 11 offered at a $229,375 average and $190,000 median. Compared with last year, the average rose 25 percent, the median 32 percent and the sale rate improved from 73 to 87 percent.
The larger Book 3 population now supports what those first five horses were telling us. The market has moved on Maxfield.
A Few Other Sire Reads Got Stronger
Flightline's second crop looked somewhat softer at the very top of the sale, where his Books 1 and 2 average and median came back from the first-crop levels. Book 3 tells a more encouraging story about depth.
Last year, eight Flightlines were offered in Book 3 and seven sold, averaging $331,429 with a $250,000 median. This year, 17 were offered and 15 are currently reported sold at a $348,667 average and $320,000 median. The offered population more than doubled, yet average and liquidity held while the median increased sharply. The first-crop novelty premium may have cooled in Book 1, but the broader market for his yearlings looks deeper.
Nyquist continues to move up as well. His Book 3 average has gone from roughly $159,000 in 2023 to $236,000 in 2024, $298,000 last year and $375,000 this year. Fifteen of 19 offered are currently reported sold for $5.62 million, including the $1.2 million session topper. The median, however, fell from $277,500 last year to $230,000, so the better horses did more of the work this time.
Yaupon may have produced the cleanest commercial profile of the three. Twenty-three were offered, 21 sold, and they averaged $214,524 with a $225,000 median. His Book 3 median has progressed from $150,000 in 2024 to $180,000 last year and $225,000 this year, even as the number offered nearly doubled. With no giant outlier carrying the numbers, the result looks like genuine depth across the group.
Book 3 Gives Us a Better Freshman Test
Books 1 and 2 are useful for evaluating freshman sires, but one exceptional physical can move an average a long way.
Book 3 gives us more horses and a better look at the middle of each draft.
| First-crop sire | Sale rate | Average | Median |
|---|---|---|---|
| Up to the Mark | 86.7% | $212,692 | $220,000 |
| Taiba | 84.2% | $198,813 | $182,500 |
| Gunite | 77.8% | $192,143 | $160,000 |
| Forte | 72.0% | $175,833 | $162,500 |
| Elite Power | 76.2% | $150,625 | $112,500 |
| Cody's Wish | 62.5% | $217,500 | $160,000 |
| Mage | 66.7% | $147,857 | $115,000 |
| Arabian Lion | 84.6% | $162,273 | $160,000 |
Up to the Mark continues to look good. His $220,000 median is the highest in this group, and 13 of 15 found buyers.
Taiba is another interesting one. Sixteen of 19 sold with a $182,500 median, giving him a cleaner profile than his position on the freshman-average leaderboard alone might suggest.
Gunite has the largest number of reported sales among the group and has moved 21 horses.
Cody's Wish presents a different profile. His $217,500 average remains one of the strongest, but only 10 of 16 offered are currently reported sold. The gap between his average and clearance is a good example of what a freshman sire leaderboard can miss.
Justify Gives Us a Useful Postscript
After everything we found in the Justify data, Book 3 produced a small but interesting result.
Six Justifys were offered and all six sold through the ring, with a $230,000 median. One brought only $12,000, so this was hardly a uniformly strong group.
The sample is too small to carry much weight on its own, but it fits something we suspected from Books 1 and 2. A portion of Justify's clearance problem may live in placement and seller expectations.
The Week 1 horses came from expensive matings, better mares and more ambitious catalog positions, and sellers frequently rejected substantial bids. Book 3 brought a different commercial context, and buyers and sellers found a price on all six.
A sire RNA rate can tell us something about demand. It can also tell us a great deal about expectations.
Constitution Looks a Little Different in Book 3
Constitution was one of the clearest cooling signals through the first two books.
Book 3 adds some nuance.
Fifteen were offered this year and 10 are currently reported sold. Those 10 averaged $198,400 with a $217,500 median. Last year, 15 of 17 sold at a $206,333 average and $200,000 median.
The successful transactions therefore held their value reasonably well, while the sale rate fell from 88 percent to 67 percent.
So the Constitution story changes depending on where in the catalog we look. Week 1 showed weaker realized prices. Book 3 showed more difficulty completing transactions.
The commercial market has cooled, but the way that cooling presents itself changes by book.
Munnings Is Increasingly a Liquidity Story
The Munnings sale-rate trend has become difficult to ignore.
His current Book 3 sale rate has moved from 82 percent in 2023 to 79 percent in 2024, 70 percent last year and 56 percent this year.
His $141,000 average is roughly back where it stood in 2023, while the median has declined from $130,000 to $105,000.
The Week 1 sample was small enough to make us cautious. Book 3 gives us a larger population and the direction remains the same. Increasingly, the issue looks like market depth rather than one weak group of horses.
McKinzie also gave some ground after a strong 2025 Book 3. Last year, 21 of 24 offered sold for a $228,476 average and $200,000 median. This year, 14 of 18 are currently reported sold at a $170,714 average and $160,000 median.
That is weaker on price, median and clearance. The longer trend is less clear than it is with Munnings, so for now McKinzie looks more like a year-over-year step back than a persistent multi-year decline.
The Filly Discount Nearly Disappeared
Last year, reported Book 3 colts averaged roughly $216,000, compared with about $174,000 for fillies.
This year the colt average is around $212,000 and the filly average about $202,000. The current sale rate is actually slightly higher for fillies, roughly 79 percent versus 78 percent for colts.
Colts still dominate the expensive tail. They account for 23 of the 33 through-ring horses at $500,000 or more and four of the five million-dollar Book 3 yearlings.
Across the core of Book 3, however, the sex discount has narrowed dramatically. That is another indication that the middle of the market was broader than the top-end colt numbers might suggest.
Clearance Is Still the Counterweight
Book 3's through-ring sale rate was 72.8 percent, down from 74.7 percent last year and 77.1 percent in 2023.
The unsuccessful bids tell us something too. The median reported bid on Book 3 horses that remain RNAs is about $95,000, exactly where it was last year.
That differs from Books 1 and 2, where the bid level underneath the unsuccessful horses increased sharply along with the sold market. Book 3 sale prices have moved higher while the bid underneath the horses that fail to sell has stood still.
The unchanged RNA bid level shows how selective the market remains. Buyers are paying materially more for the horses they like, but they have not raised the floor nearly as much for the ones they do not.
Where We Stand After Six Sessions
After six sessions, I think the market looks deeper than it did after Book 2. The top remains extraordinarily expensive, but Book 3 showed that the gains are reaching well into the middle of the sale and across a much broader range of sires. Major buyers are still here, and they are willing to move away from the fashionable stallions when they find the individual they want.
Several sire stories also look different with another book of evidence. Life Is Good's second-crop move now has real depth. Maxfield's rebound is no longer based on five horses. Flightline's broader market held despite much more supply. Up to the Mark and Taiba are showing better freshman depth than their headline averages alone reveal. Constitution's cooling looks different by catalog position, while the Munnings liquidity trend is becoming increasingly difficult to explain away as noise.
Clearance remains the counterweight. Book 3 sold fewer horses than last year, and the median bid on the unresolved RNAs has not moved despite the substantial increase in successful sale prices. The good Book 3 horse is worth considerably more than it was a few years ago, but the floor has not risen nearly as much for everything else. That gap between what buyers will pay for the horses they want and what they will tolerate on the rest may be the best way to understand Keeneland September through six sessions.
Thoroughbred Intelligence analyzed hip-level results from Keeneland September Books 1 through 3 for 2023 through 2026. Macro sale figures use through-the-ring transactions. Sire, buyer and sex analyses use current reported transactions, including identifiable post-sale transactions where noted. Initial sale rates exclude withdrawals. Buyer concentration is calculated from reported buyer labels and does not attempt to consolidate related entities, agents or partnerships beyond the names shown in the results. Historical published figures were reconciled to the corresponding book and session populations.